There are no official statistics on the number of strikes and worker protests in China. CLB’s Strike Map is currently the only publicly accessible database that contains detailed information on more than 12,000 workers’ collective actions in China dating back to 2011.
There are no official statistics on the number of strikes and worker protests in China. CLB’s Strike Map is currently the only publicly accessible database that contains detailed information (in English and Chinese) on more than 12,000 workers’ collective actions in China dating back to 2011.*
The map is updated daily by our staff in Hong Kong. To get the latest updates, please follow @CLBStrikeMap (English) and @bagongditu (Chinese) on Twitter and subscribe to our monthly newsletter, which uses Strike Map data to pinpoint the latest trends in worker activism in China.
The Strike Map is designed to help journalists, researchers and trade unionists etc. better understand the frequency and distribution of strikes as well as the characteristics of worker protests in China. To this end, CLB publishes regular news articles and features analysing recent Strike Map incidents. We also produce occasional in-depth research reports that provide a more comprehensive analysis of the data over a longer period of time and across a range of industries and professions.
For those wishing to do their own analysis or identify specific trends in worker protests, the various interactive features of the map are outlined below.
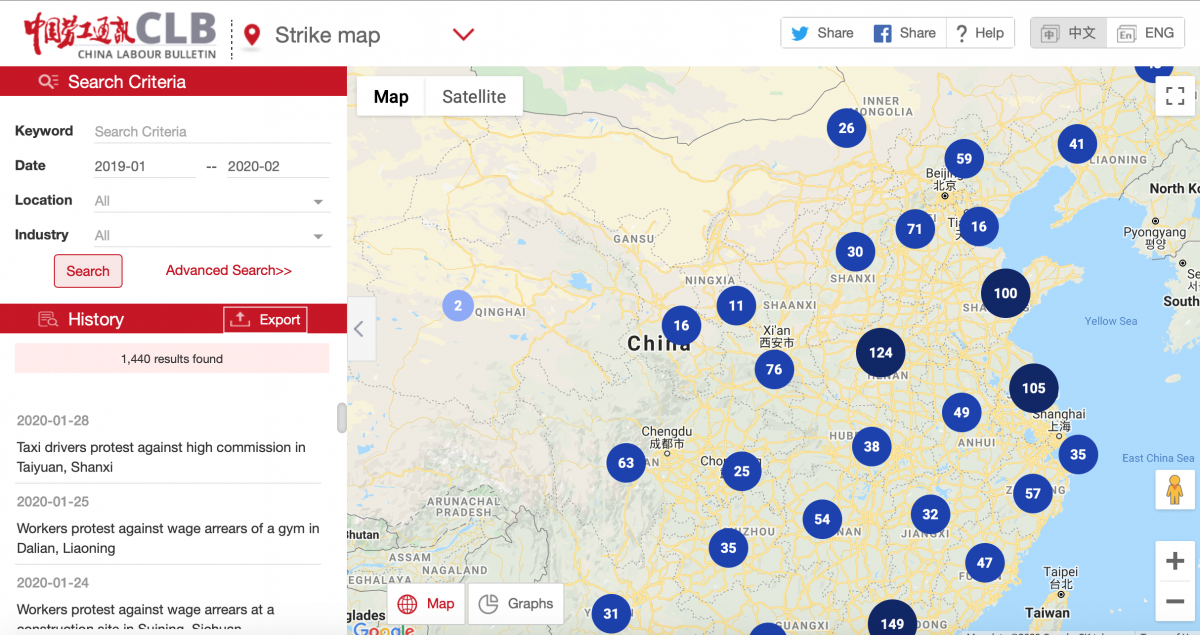
The default date range on the map is the last six months but you can select any dates from January 2011 onwards. The results are displayed grouped by province on the map and listed chronologically in the left-hand sidebar (see screenshot below).
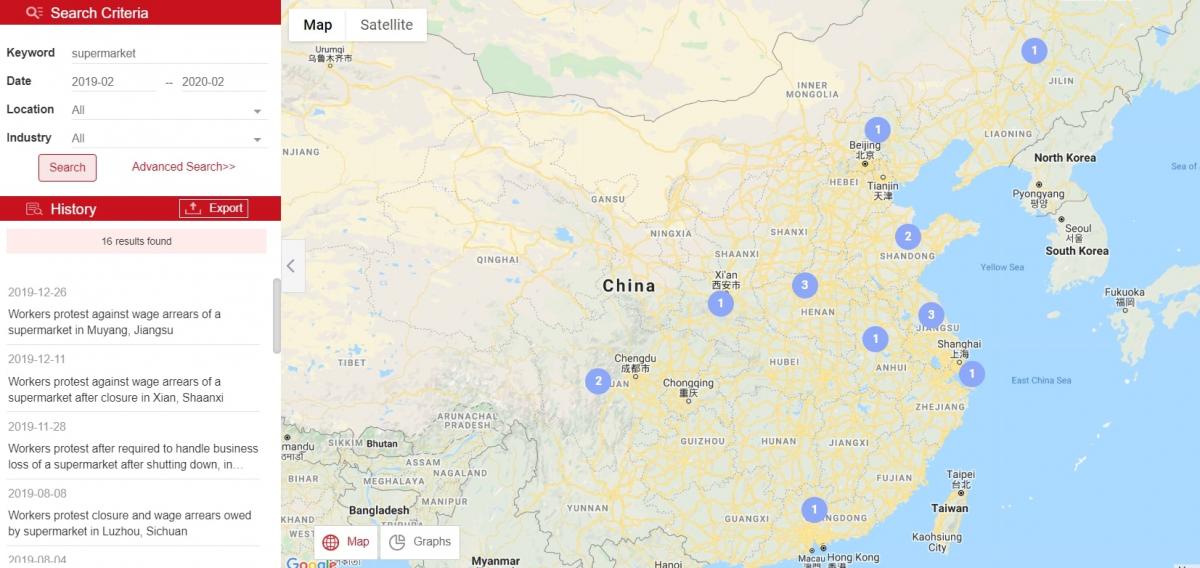
Once you have established your desired timeframe, you can select data from one particular region and/or one particular industrial sector. You can choose a province or even an individual city, and then the industry you are interested in. For example, the manufacturing sector in Guangzhou from August 2019 to February 2020 and zoom in on the map for more details. You can also select various industrial sub-sectors, such as electronics under manufacturing, food delivery under transportation or sanitation workers in services. Or you can search simply by typing in a keyword, such as “supermarket,” to see all the protests by supermarket employees over the time period selected.
For more options and parameters, click Advanced Search. Here you can select enterprise type (private enterprise, SOEs etc), the employee demands (for example payment of wages in arrears), the type of collective action taken by the workers and the number of participants.
In many, but not all cases you can examine the response of the employer and the local authorities to the workers’ protest actions, such as police arrests or negotiations. But be advised that most records on the responses are not comprehensive because follow up information are generally not available in the materials used to compile the map. However, CLB has investigated several incidents as part of examination of the All-China Federation of Trade Union’s reform initiative. You can see these cases by clicking the box Trade Union Accountability listed under Response to Collective Action.
Users can conduct further analysis based on the map’s underlying data by exporting the selected data to an Excel file. Just click the button [Export data] at the top of the left hand sidebar incidents list. Please note that it is easier to export smaller files with fewer entries.
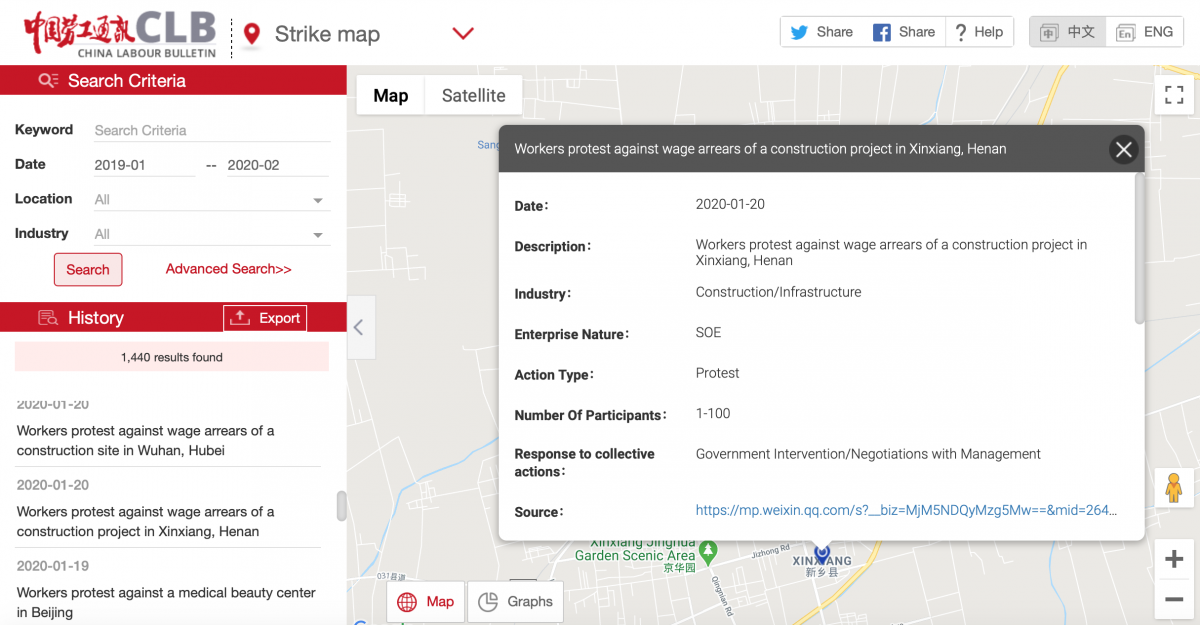
To get more details on specific incidents, click on the incident marked on the map or listed in the left-hand sidebar. Here you will get a brief description of the event, plus links to and screenshots of the source material in Chinese. We cannot verify all the information contained in the original source. However, it is believed that the basic elements, such as time and location are correct. Normally, the precision of the locations displayed on the maps is limited to the extent of counties or cities.
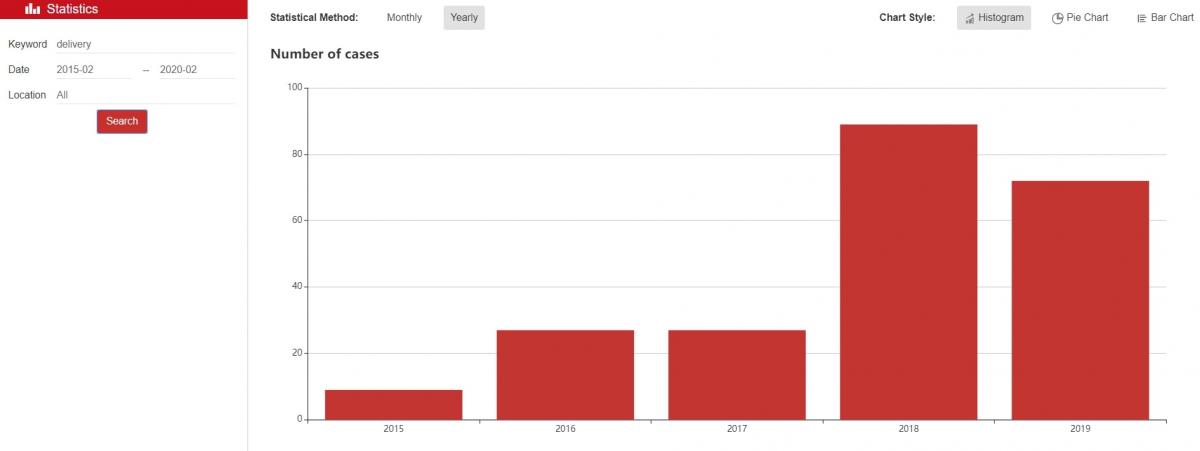
The map now displays data in graphic/statistical form. Just click on Graphs in the lower left-hand corner of the map. This will take you to a histogram displaying the number of incidents in each year or each month. As with the map, you can fine tune the graph to display worker protests in specific sectors over time. For example, delivery driver protests between February 2015 and February 2020.
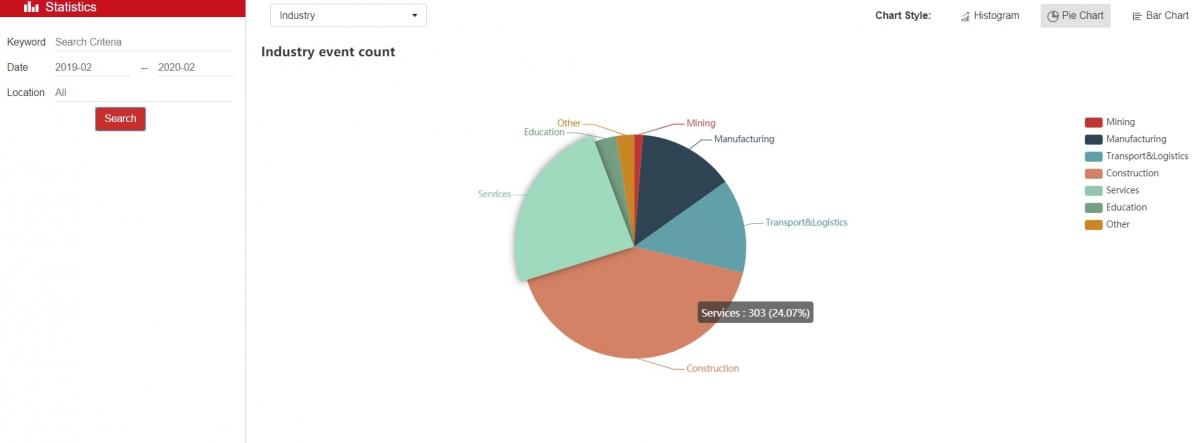
If you select the pie chart function you can compare data based on different criteria such as industry, employee demands and company ownership type. Just move your cursor over the chart to display the actual number and percentage of incidents in each category.
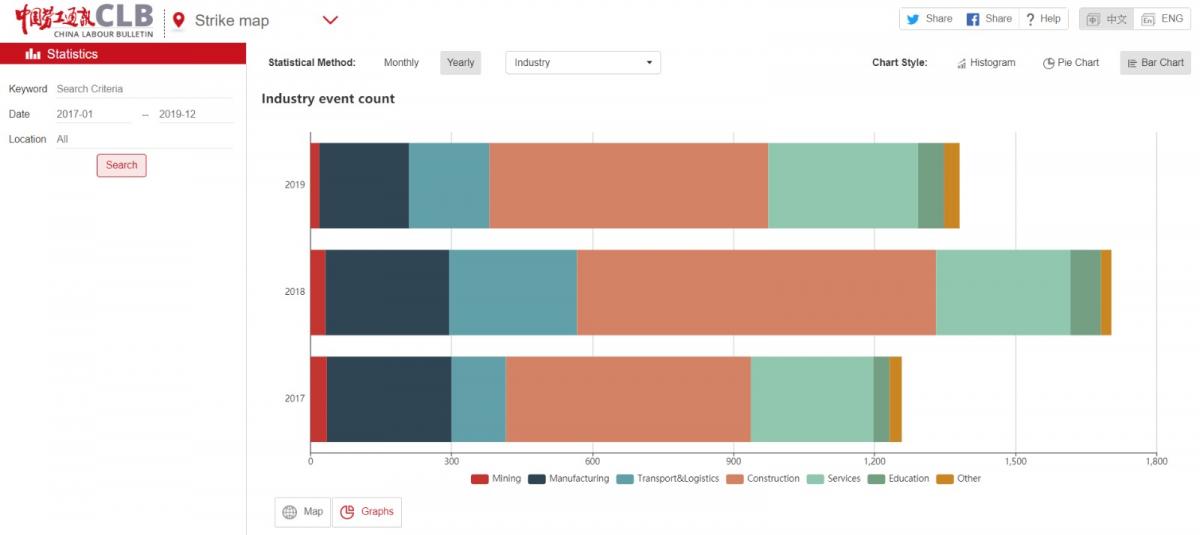
The bar chart combines the histogram and pie chart functions so that the data for each year or month over a defined time period can be broken down into specific industries etc.*
* It is important to note that the Strike Map is not a definitive record of all the strikes in China. We can only record those incidents that are in the public domain, usually posted on Chinese social media and occasionally in the official media as well. We estimate that – based on the occasional and partial statistics issued by the national and local governments in China – the Strike Map currently accounts for about five to ten percent of all incidents of worker collective action in China. However, that sampling rate has varied over the years so we would caution against comparing incident totals over an extended period of time.